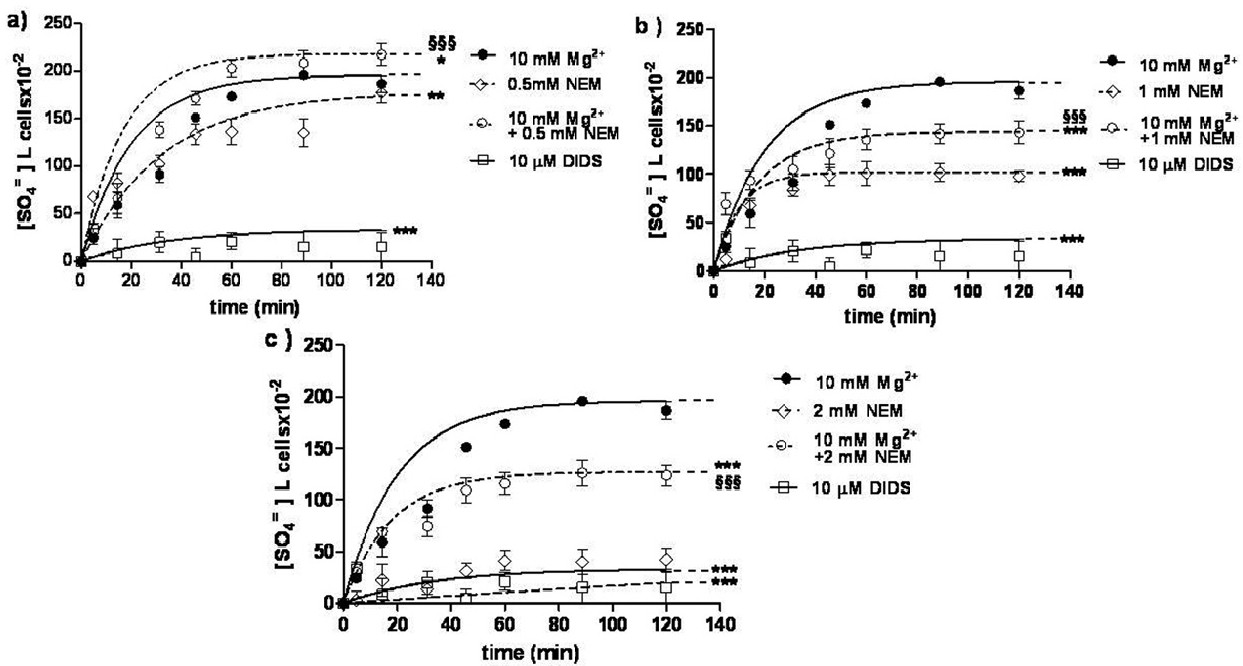
Fig. 8. Time course of SO4= uptake in human erythrocytes measured in control conditions (10 mM Mg2+) or with 0.5 mM (A), or 1 mM (B) or 2 mM NEM (C), or with 10 mM Mg2+ + either 0.5 mM (A), or 1 mM (B) or 2 mM NEM (C), or with 10 μM DIDS (A-B-C). Points represent the mean ± SD from at least 5 separate experiments (see Table 1), where ***p<0.001, **p<0.01 and *p<0.05 versus control; °°°p<0.001 versus either 0.5 mM, or 1 mM, or 2 mM NEM.